KingKond
Lot development
A 320-lot development in three stages, organized on the satellite map
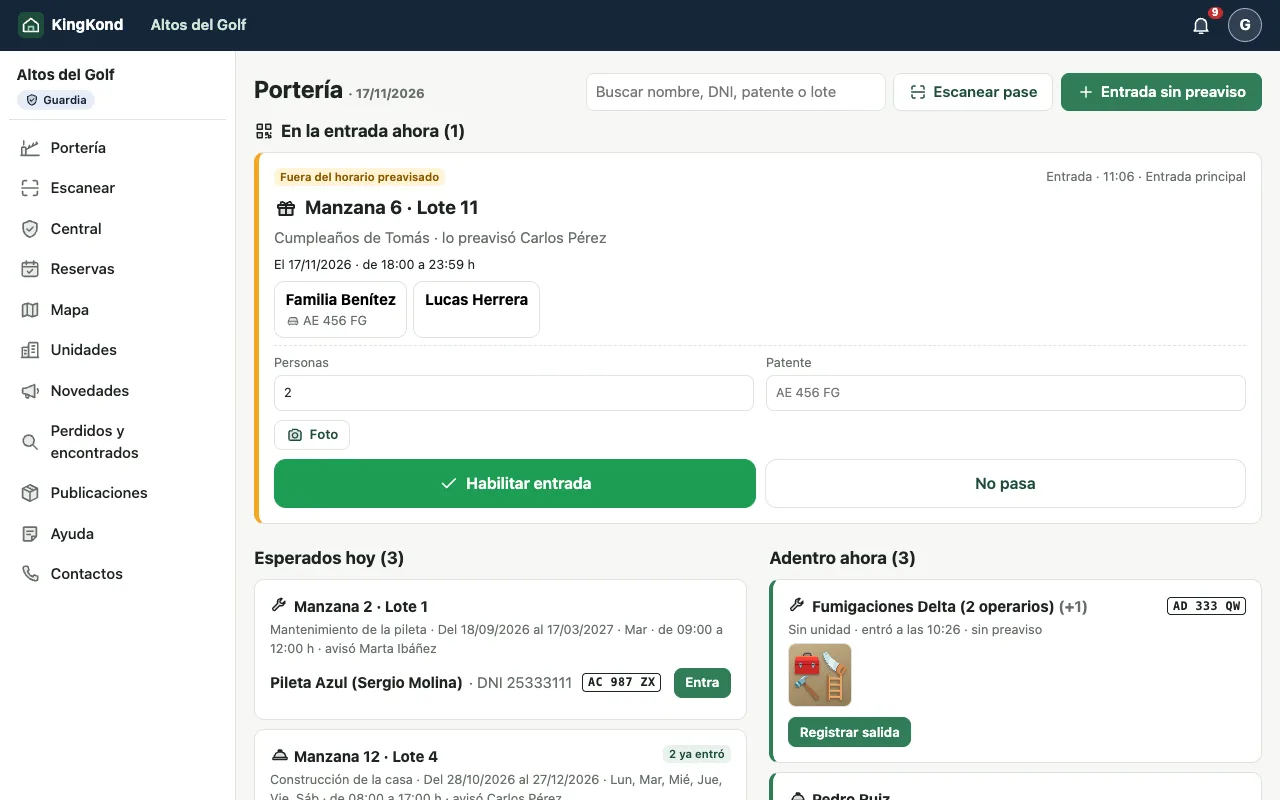
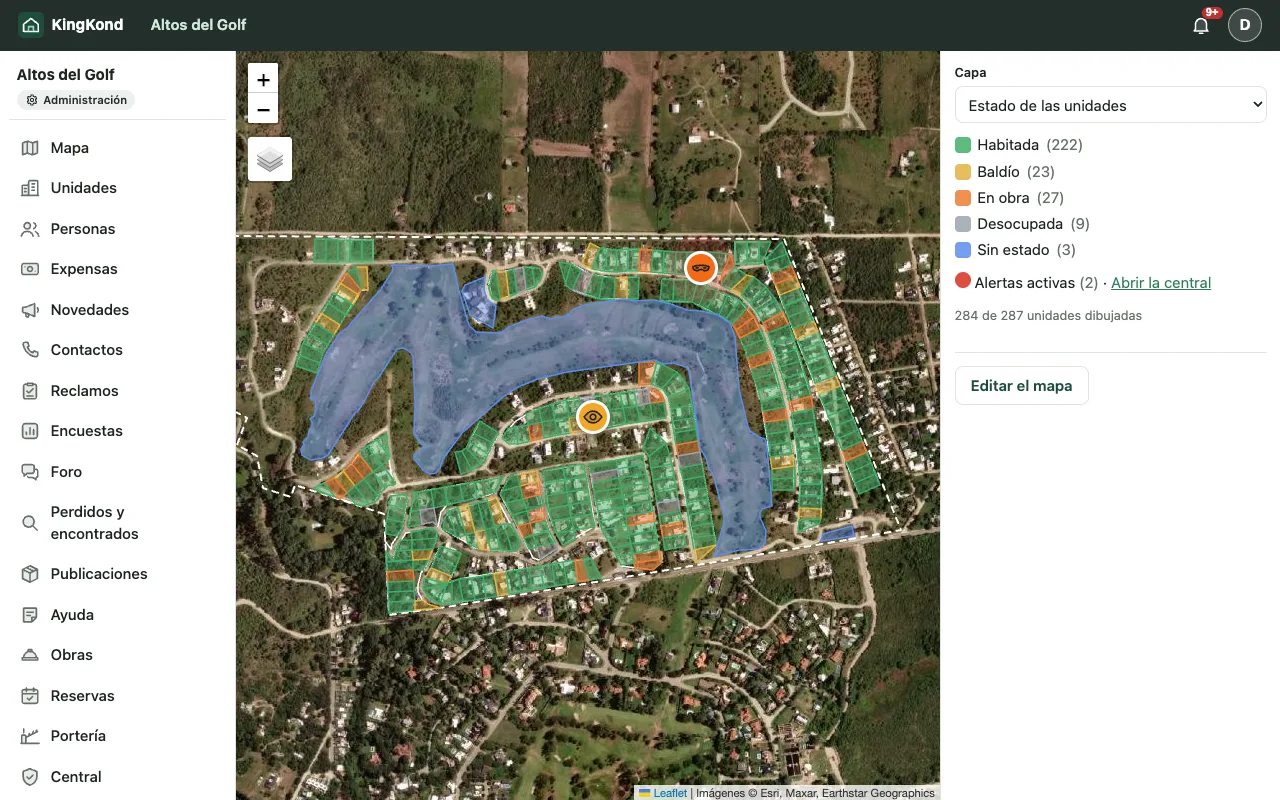
Terrazas del Arroyo uses the KingKond map to track sold, under construction and vacant lots, and worker passes that follow the dates of each work.
- 3stages on one map
- 140works under way at once
- -70%gatehouse calls about workers
Illustrative case: the community, the people and the figures are fictional. They show how KingKond is used in a typical situation.
A development that changes every week
Terrazas del Arroyo was launched in three stages. While the first already had families living there, the second was full of construction and the third was still on sale. The developer, the administration and the guard each worked with different PDF plans, and nobody knew for sure which lot was in which state.
The map as the source of truth
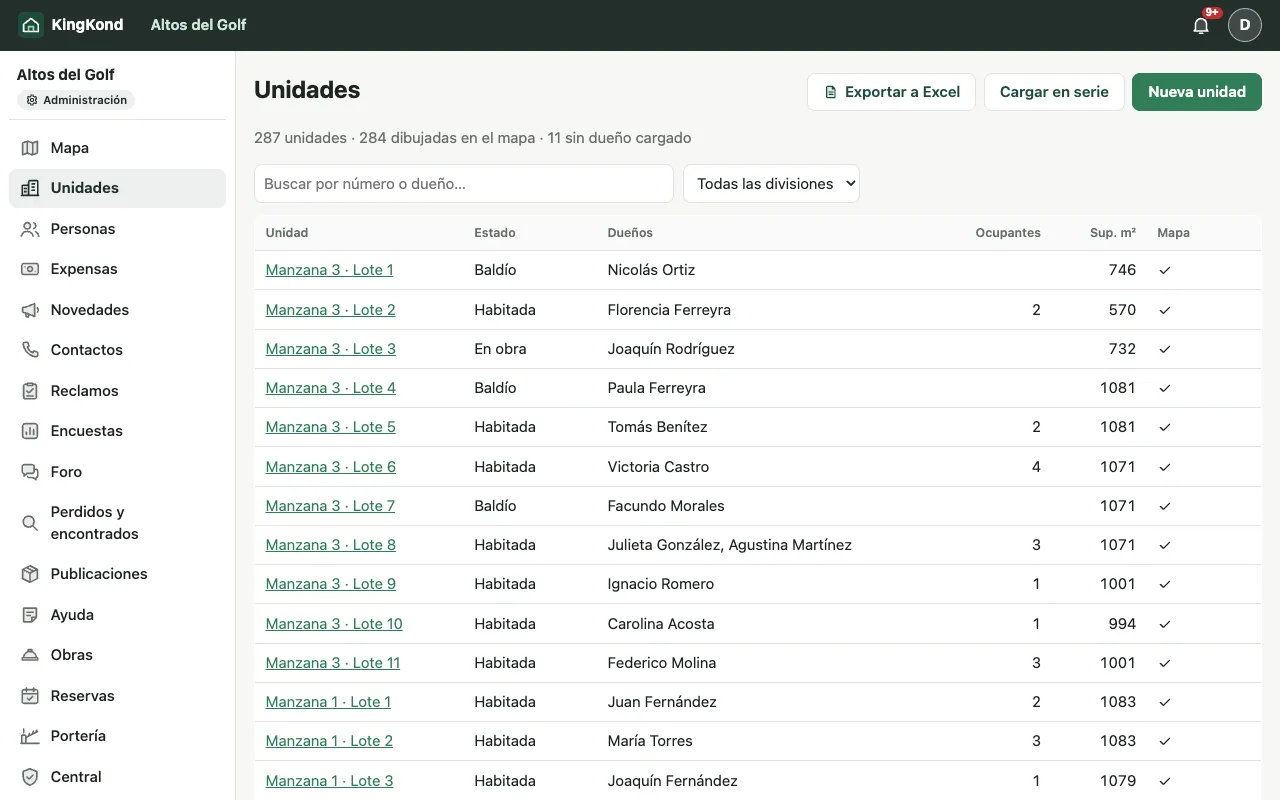
With KingKond they drew the 320 lots over the real satellite image, grouped into zones by stage, with the streets and common areas. Each lot opens its file: owners, occupants, current account and status.
- Status layers: occupied, under construction or vacant, at a glance.
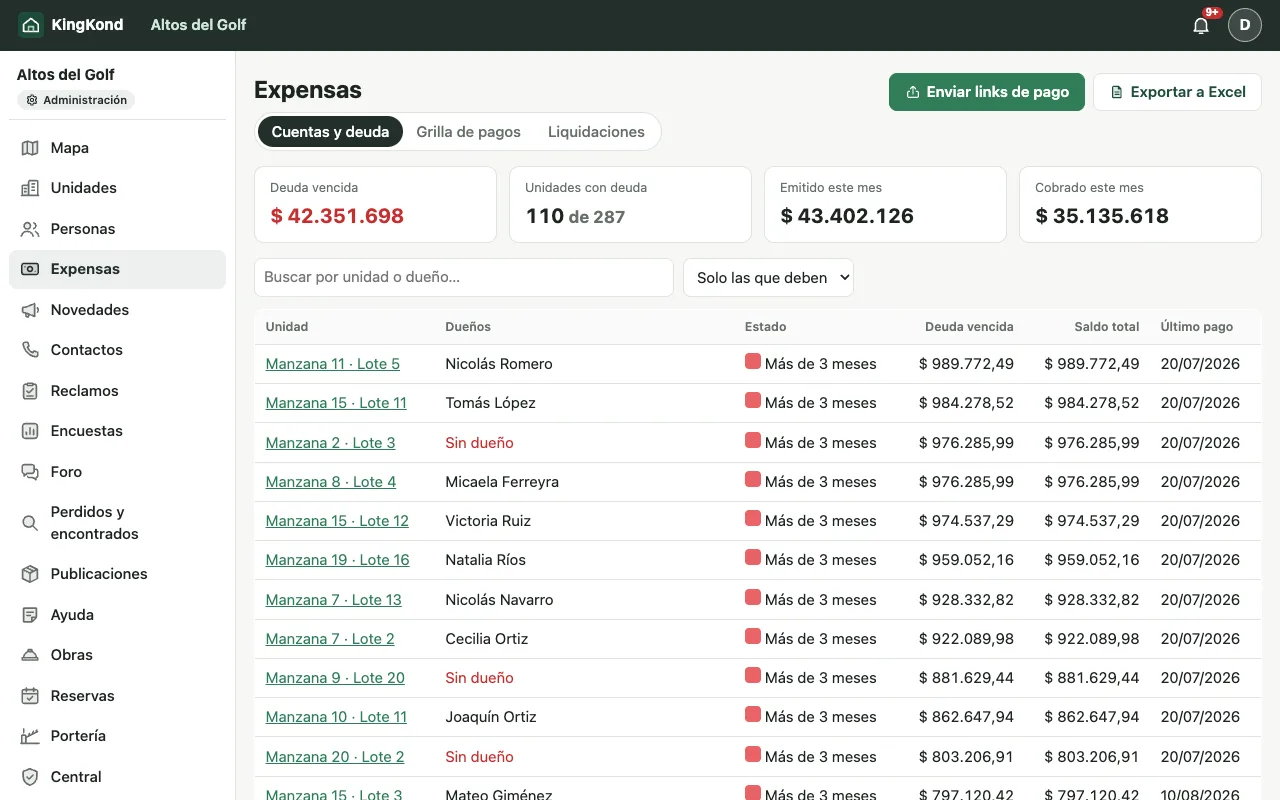
- Owner and debt layers, for the administration and the council.
- Streets with names and direction, which the guard also sees to guide visitors.
Works and workers without loose paperwork
Each work is registered with its dates and the person in charge. The workers of a work get a pass that lasts as long as the work: if it is extended, the pass is extended; when it ends, the pass stops working by itself. At the gatehouse the guard sees who goes to which lot, with a photo of the ID and the vehicle, and what leaves is checked against the declared materials.
"The guard used to call the owner for every crew. Now the pass already says which work they are going to and until when." (development's administration)
Results
The guard's calls to owners about workers fell by 70%. The developer uses the same map to show which lots are left, and the administration starts issuing fees by stage as the lots are handed over.
For developments that are just starting
Draw the whole development from day one, even the stages that are not sold yet: the map becomes everyone's reference and avoids outdated plans. See how it looks in the demo.